
What is bibliometric analysis?
How to map a field's structure without reading thousands of publications one by one.
What is bibliometric analysis?
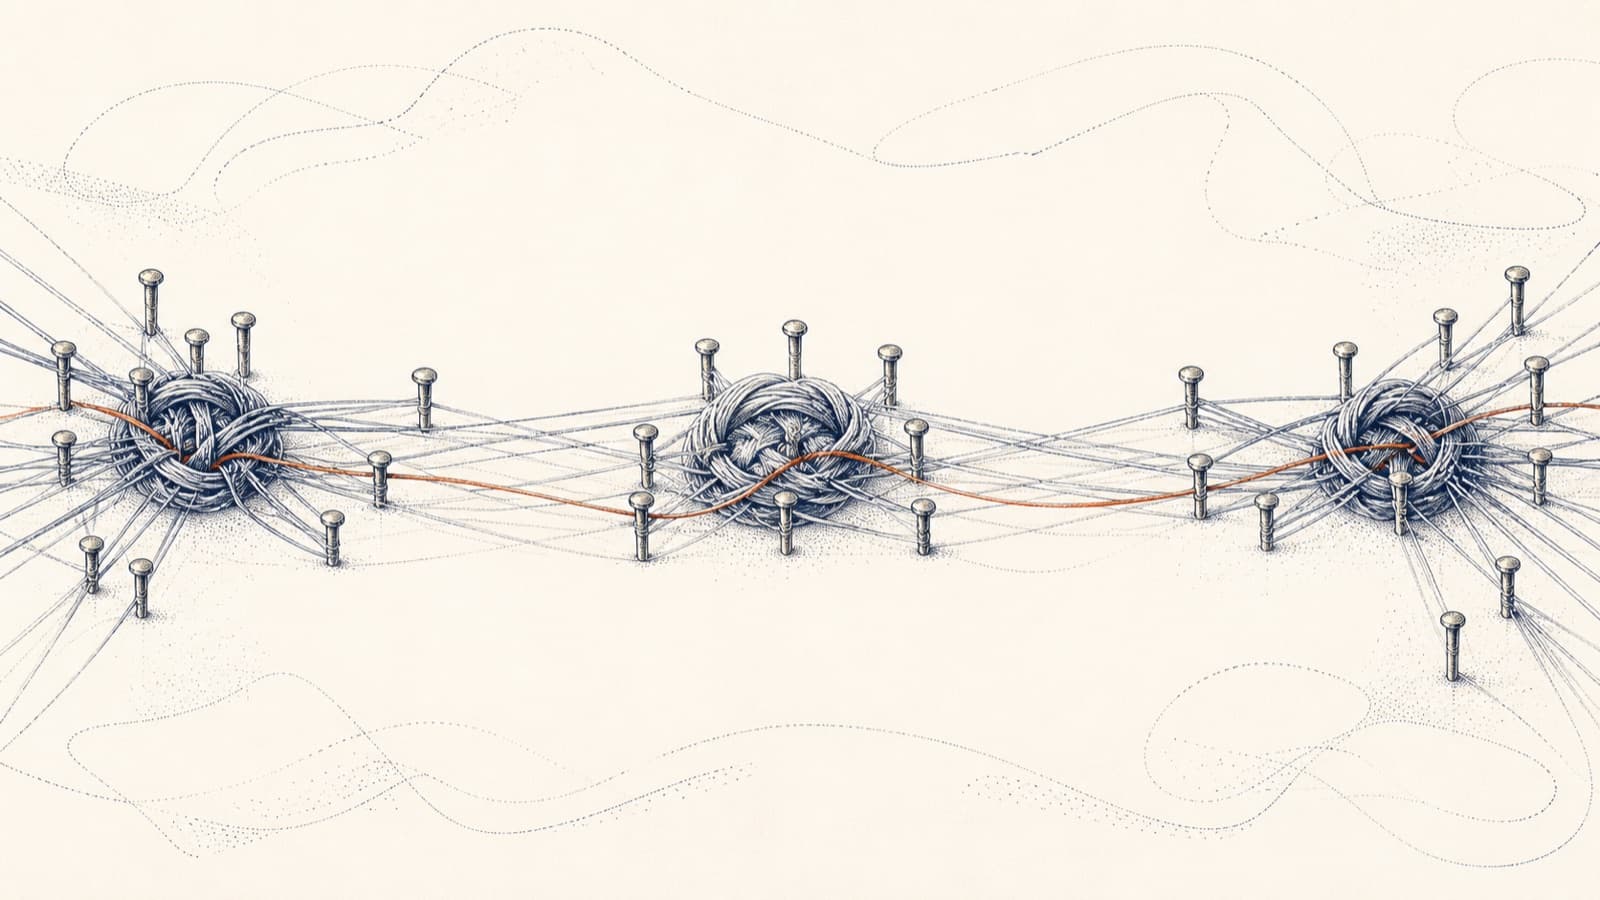
Bibliometric analysis measures scientific communication by applying mathematical methods to publications and their links; Pritchard (1969) coined the term. The output is a numerical map of who the field is made up of and which clusters it forms.
The unit the method operates on is not an article's text but its record: title, abstract, authors, institutions, journal, year, references. Across thousands of records these produce a network showing who produced the field, where.
The analysis answers two questions: descriptive (how many publications, which journals stand out) and structural (which studies are cited together). The real value is in the second.
The approach is not new, the scale changed: machine readable reference data now covers a field in one study.
- When it fits: the field is broad, too many publications for one person to read.
- When it does not fit: the question is narrow, individual findings need comparing.
- Precondition: a source with populated reference fields that can be deduplicated and exported.
- Accepted limit: measures what has been published, not what is unindexed.
What is the difference between bibliometrics and a systematic review?
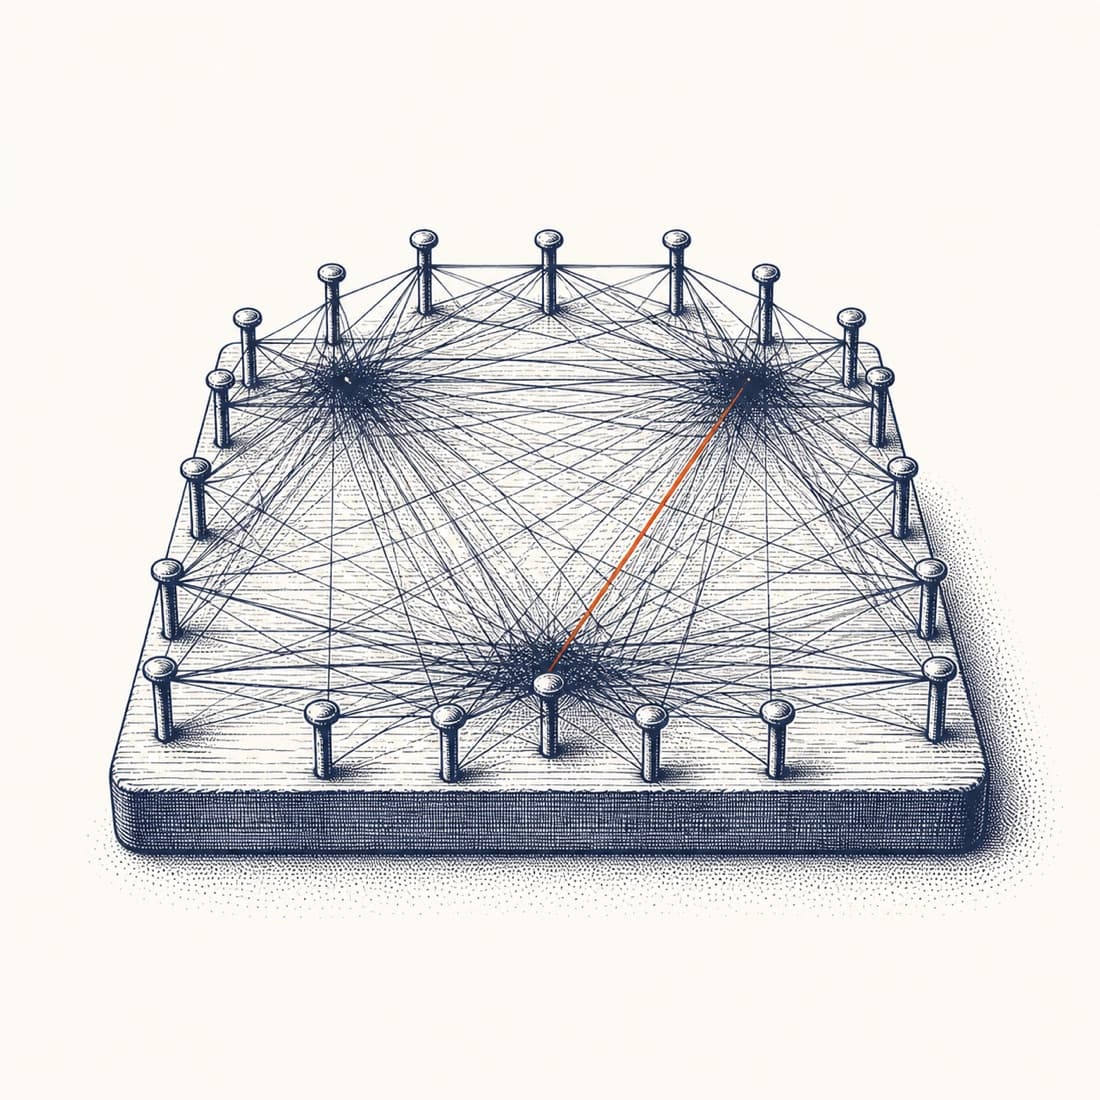
A systematic review answers a question, a bibliometric analysis maps a field's structure. A review reads studies one by one; bibliometrics does not read the text, it counts links between records.
| Criterion | Bibliometric analysis | Systematic review |
|---|---|---|
| Question it answers | What does this field look like? | What does the evidence say about this question? |
| Unit of study | Publication record and the links between records | The study itself and its finding |
| Relation to text | Text is not read, metadata is counted | Full text is read |
| Quality assessment | None, out of scope | Risk of bias is assessed |
| Typical scale | Thousands of records | Dozens of studies |
| Output | A map and structure of the field | Synthesised evidence and a conclusion |
The difference is not in rigour: a systematic review's framework is PRISMA 2020 (Page et al., 2021) and bias is assessed with the Cochrane handbook (Higgins et al.).
The two approaches are not alternatives either: bibliometrics maps the field, the review descends into a chosen cluster (Cooper, 1988; Webster and Watson, 2002).
For a step by step review protocol, see the how do you run a systematic review guide.
Which analysis types are there?
Bibliometric analysis types are distinguished by which link is counted: co-citation, bibliographic coupling, co-word and co-authorship.
Co-citation analysis
Two studies are co-cited when they appear together in a third study's reference list (Small, 1973). Clusters show the field's intellectual base.
The link is retrospective: two studies not cited together today can fall into the same cluster later.
Bibliographic coupling
Two articles are bibliographically coupled if they cite common sources (Kessler, 1963); the link is formed at publication and never changes.
Co-citation shows the past's shared ground, coupling shows today's shared interest.
Co-word analysis
Terms occurring together are counted and a network is built between concepts (Callon et al., 1991); it does not wait for citations, so new concepts enter immediately.
Its cost is term cleaning: synonymous terms appear as separate nodes unless merged.
Co-authorship analysis
Authors who share a byline are linked; the network shows research groups and collaborations.
Its weak point is disambiguating names: different researchers sharing a name merge into one node.
What does a clustering algorithm do?
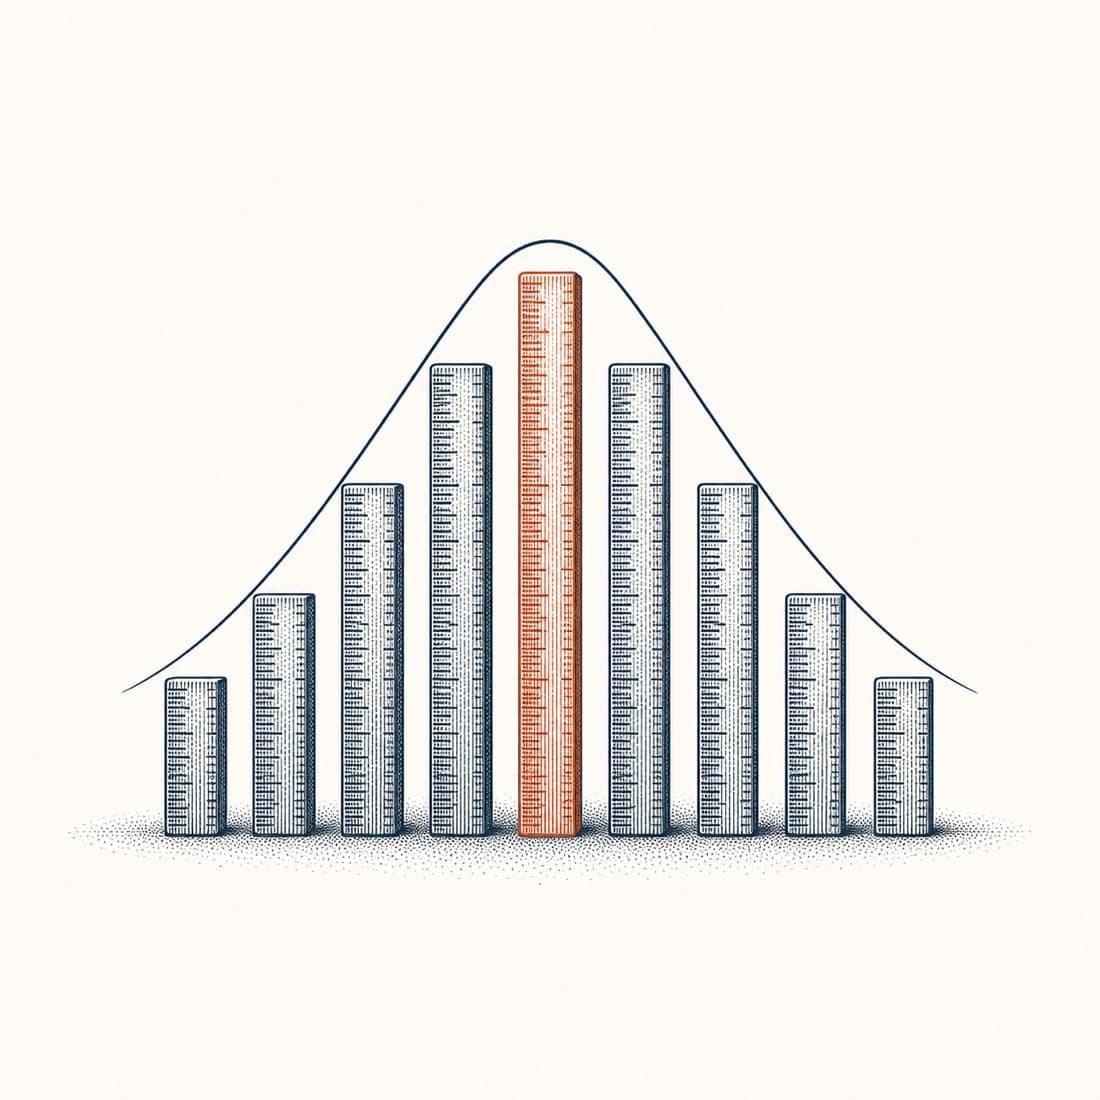
A clustering algorithm splits a network's nodes into groups densely linked within, sparsely linked outside. Algorithm and resolution choice changes how many themes come out.
The common measure is modularity: within-cluster density against a random network's. Louvain improves this fast and was the default for a long time (Blondel et al., 2008).
Traag et al. (2019) showed a flaw: some clusters can be internally disconnected. Leiden guarantees clusters stay connected.
Algorithm choice is part of the method, not a preference, and it is reported.
- The algorithm's name and version are written down.
- The resolution parameter and, if used, the randomness seed.
- The number of clusters is determined by the data, not the reader.
- The name given to each cluster is an interpretation, not the output.
- A disconnected cluster check is performed.
How is the strategic diagram read?
The strategic diagram positions themes from a co-word analysis on two axes: centrality shows how much a theme connects, density how tightly linked it is within itself (Callon et al., 1991).
| Zone | Centrality | Density | Reading |
|---|---|---|---|
| Motor themes | High | High | Themes that drive the field, mature and densely connected. |
| Specialised themes | Low | High | Deep within themselves but disconnected from the rest of the field. |
| Emerging or declining themes | Low | Low | Newly emerging or being abandoned; time slices tell you which. |
| Basic and transversal themes | High | Low | The field's common ground; connects to many themes but has not deepened. |
The diagram has two traps: the axes are relative to the corpus, widening the query can shift a theme to another region. The low centrality and low density region places opposite situations in the same spot.
A single snapshot cannot resolve this, the corpus needs time slices.
The diagram alone is not enough for a reading aimed at finding a gap; disconnected areas between clusters also need examining. How that reading is done is explained in the how do you find a research gap guide.
What do citation counts measure, and what do they not?
A citation count measures how much a study is used, not its quality; a study is cited for being criticised too. Different years cannot be compared on raw counts.
The most common author level measure is the h-index: a researcher having h publications each with at least h citations (Hirsch, 2005). It depends on career length and cannot be compared across fields.
- Field difference: citing habits vary, raw counts are meaningful only within a field.
- Accumulation effect: older publications have had more time to gather citations.
- Self-citation: unless separated out, an author's own citations inflate the count.
- Database coverage: each database indexes a different journal set, gives a different count.
- Format bias: fields weighted toward books and local-language work are underrepresented.
- Meaning gap: a citation is a mark of use, not approval.
If a comparison is made, field and year are held fixed; the same query gives a different number six months later.
How is a bibliometric study made reproducible?
A bibliometric study is reproducible if a third person, building the same corpus and running the same steps, can reach the same result: query exact, database and dates stated (Peng, 2011).
Bibliometric data is a moving target: the same query can return a different number of records two weeks apart, so the retrieval date is part of the method.
Peng (2011) treats sharing data and code as the minimum condition; here that means the raw record file and analysis script (FAIR, Wilkinson et al., 2016).
- The database, its version and the access route.
- The exact query string, with field and date restrictions.
- The date the corpus was retrieved.
- The inclusion and exclusion criteria, with records eliminated at each step.
- The deduplication method and the term merging dictionary.
- The network type, clustering algorithm, resolution parameter and randomness seed.
- The software used and its version numbers.
- The raw corpus file and analysis script, ideally with a persistent identifier.
This list is not a formality: most decisions are made at intermediate steps. When unwritten, the result becomes impossible to discuss.


Which tools do this work?
These steps can also be run by hand; the difficulty is not in the steps but the record between them.
SciMind is building a platform that brings this work together in one workflow.


Related guides

References
- Pritchard, A. (1969). Statistical bibliography or bibliometrics? Journal of Documentation, 25(4), 348-349.
- Kessler, M. M. (1963). Bibliographic coupling between scientific papers. American Documentation, 14(1), 10-25.
- Small, H. (1973). Co-citation in the scientific literature. Journal of the American Society for Information Science, 24(4), 265-269.
- Callon, M., Courtial, J. P. and Laville, F. (1991). Co-word analysis as a tool for describing the network of interactions. Scientometrics, 22(1), 155-205.
- Blondel, V. D., Guillaume, J. L., Lambiotte, R. and Lefebvre, E. (2008). Fast unfolding of communities in large networks. Journal of Statistical Mechanics, P10008.
- Traag, V. A., Waltman, L. and van Eck, N. J. (2019). From Louvain to Leiden: guaranteeing well-connected communities. Scientific Reports, 9, 5233.
- Hirsch, J. E. (2005). An index to quantify an individual's scientific research output. PNAS, 102(46), 16569-16572.
- Page, M. J. et al. (2021). The PRISMA 2020 statement: an updated guideline for reporting systematic reviews. BMJ, 372, n71.
- Higgins, J. P. T. et al. (Ed.). Cochrane Handbook for Systematic Reviews of Interventions. Cochrane.
- Cooper, H. M. (1988). Organizing knowledge syntheses: a taxonomy of literature reviews. Knowledge in Society, 1(1), 104-126.
- Webster, J. and Watson, R. T. (2002). Analyzing the past to prepare for the future: writing a literature review. MIS Quarterly, 26(2), xiii-xxiii.
- Peng, R. D. (2011). Reproducible research in computational science. Science, 334(6060), 1226-1227.
- Wilkinson, M. D. et al. (2016). The FAIR Guiding Principles for scientific data management and stewardship. Scientific Data, 3, 160018.
Need to map out the literature?
Bibliometric network analysis, thematic mapping and evidence synthesis run in one workflow.